Valcour Ad-Targeting · loading
Loading the targeting assistant. This can take a few seconds while the data layer warms up.Know where every ad dollar has the most leverage.
Ask where to advertise anything, a product, a brand, or a campaign, and get a ranked list of places, a map, and the reasoning behind each: the size of the audience you can reach, how well it fits, and where the airwaves aren’t already crowded.
Ad-opportunity intelligence for any advertiser
3
Signals behind every score
12+
Public data sources, cited in every answer
1RANK
County-by-county, every query
5–95
Confidence band on every score
What you get back
An answer you can act on.
You ask a plain-language question. The assistant returns a ranked opportunity list and shows its work. Nothing is a black box.
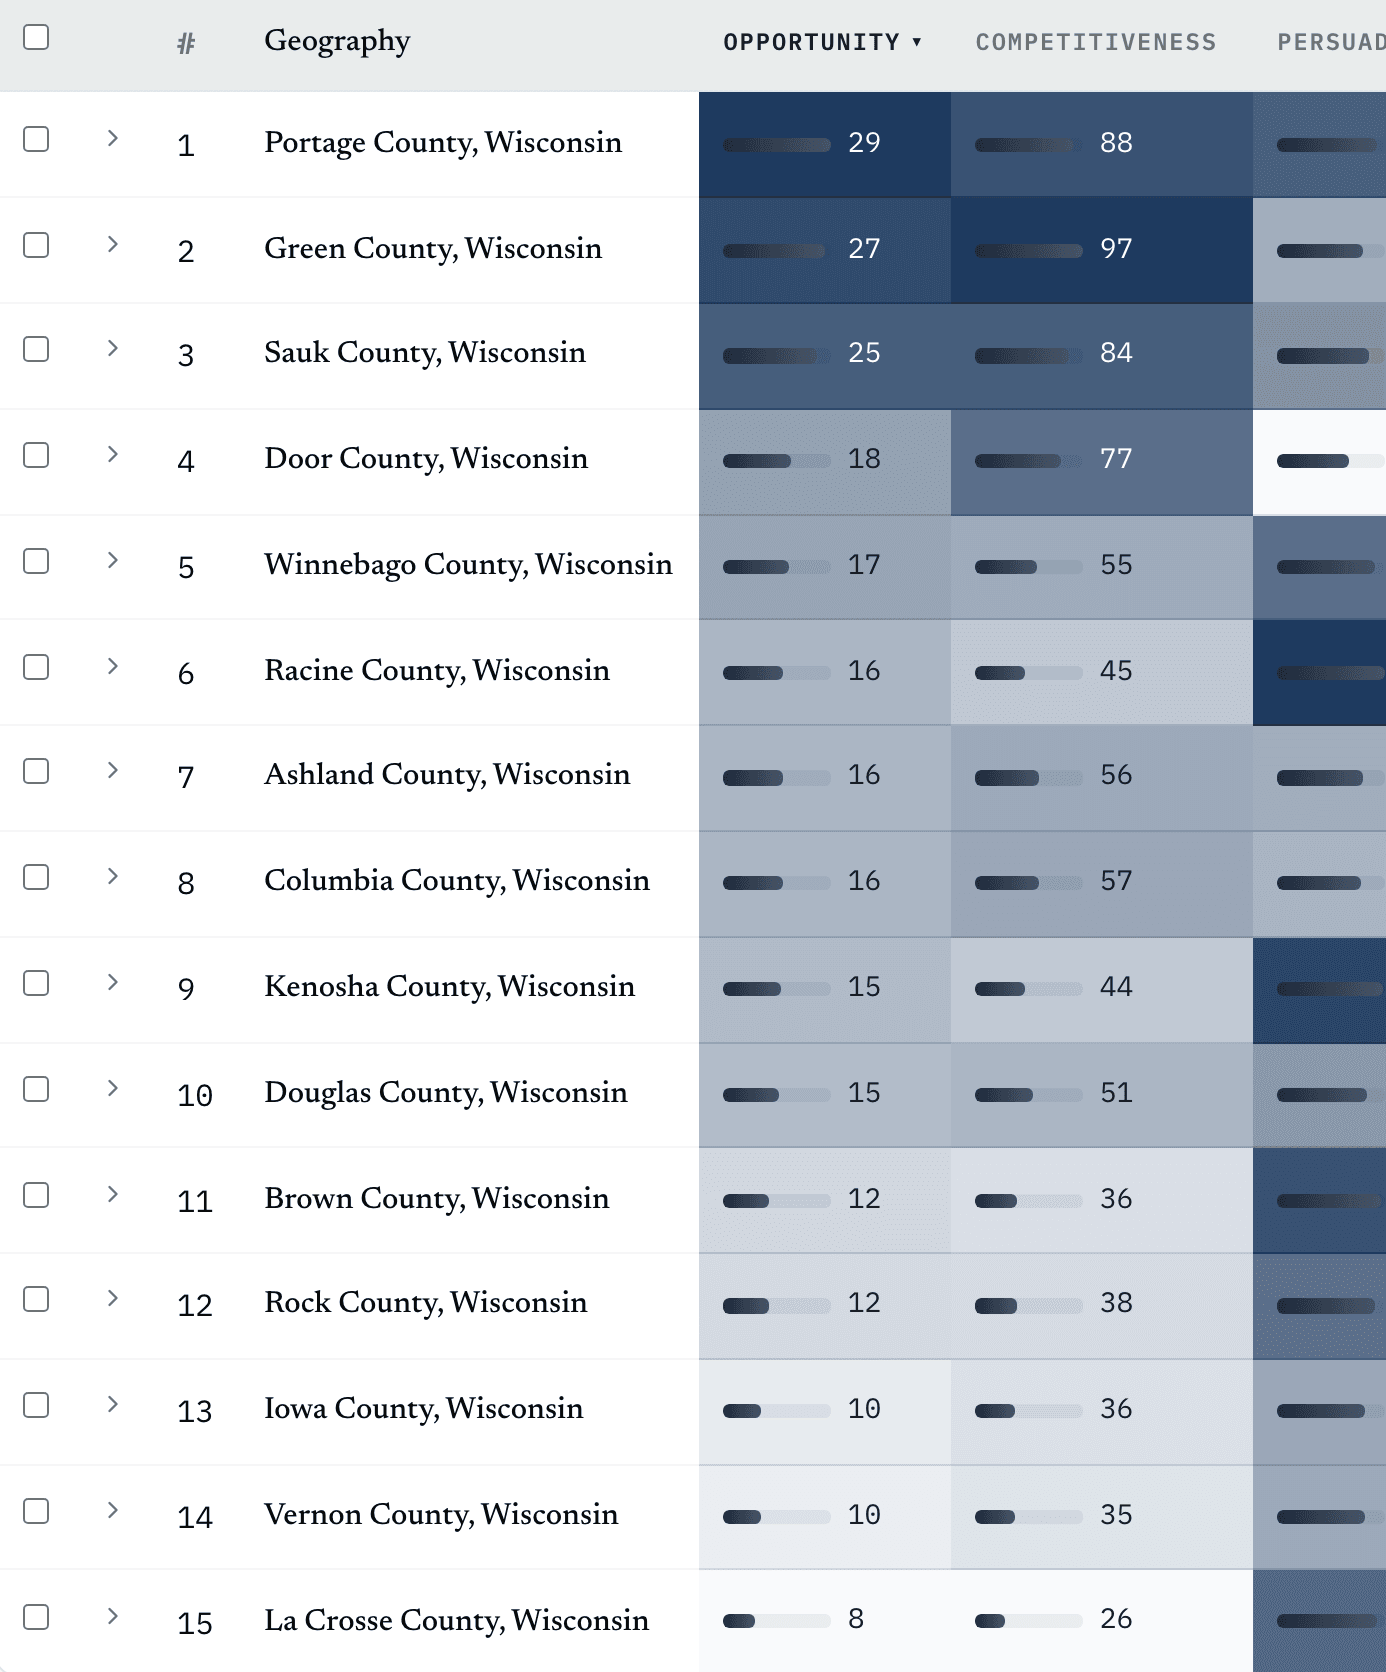
- A ranked list of geographies.Counties ordered by where the marginal ad dollar has the most leverage, highest first.
- A map of the opportunity.The same ranking rendered visually, so the pattern across the state reads at a glance.
- The signals, broken out.How large the reachable audience is, how well the market fits, and how saturated current ad spend already is.
- A confidence range on every score.A 5th-to-95th band, not a single false-precision number. The inputs are estimates and we say so.
How opportunity is scored
See why a place ranks where it does.
Each score combines the size of the audience you can reach, how well that market fits what you’re advertising, and how saturated current ad spend already is. Crowded markets get discounted; large, well-fit, under-targeted markets rise to the top. Every input traces to a named public source.
Reach
Audience fit
Ad saturation
> show me only the biggest markets with low ad saturation
parsed · 2 filters applied
re-ranking 1 query across counties…
top opportunity Maple Ridge→Lakeshore
illustrative · every score shows its confidence range
How you use it
Ask in plain language. Narrow as you go.
“Where should I advertise my coffee brand?” “Show me only the biggest markets.” “Which of these is least crowded right now?” The assistant re-ranks as the conversation tightens, so you end on the shortlist that actually fits your map and your budget.
Most ad budgets follow the polls everyone already reads. The leverage is in the races that are close and the audiences no one is fighting for yet.
How it works
Three steps, one conversation.
- 01
Ask where to advertise
Name the state, the race, or the constraint. Plain language, no setup, no spreadsheet.
- 02
The assistant scores it
It weighs the reachable audience, how well each market fits, and current ad saturation across every place, then ranks them.
- 03
You get a ranked map
A list, a map, and the reasoning for each, with a confidence range on every score. Narrow it by asking again.
Read the full methodology: every signal, source, and what it does not do →
The data
Built on public, citable sources.
The assistant reads from more than twenty public datasets: certified election returns, the Census, FEC filings, BLS, live polls and markets, and more. Every figure in an answer traces back to a named source, never to a model guessing on its own.
MIT / OpenElectionsCertified county + precinct returns
Census ACS · CPSDemographics, turnout, language
FECFinance + donor geography
Google · FCCDigital + broadcast ad spend
Nielsen DMA · BLSMedia markets + local economy
Polymarket · pollsLive odds + survey aggregates
What backs the score
A score is only useful if you can trust how it was built.
We don’t ask you to take a ranking on faith. The formula is published, every input is a named public source, and the assistant tells you when a signal is a proxy rather than a measurement.
One published formula
Opportunity = reach × favorability × fit ÷ (1 + ad-saturation). Large, well-fit, under-targeted markets rank highest; crowded markets are discounted. The exact formula, and every assumption inside it, lives on the methodology page.
A range, not false precision
Every score carries a 5th-to-95th percentile band from a Monte-Carlo pass over its three inputs. When two geographies’ ranges overlap, the assistant says so rather than implying a difference the data can’t support.
Honest about what it isn’t
This is an opportunity prioritizer, not a vote-lift predictor and not a media-buying platform. It does not claim a dollar in any county produces a number of votes. It ranks where conditions favor advertising having leverage, and it is an early product, built source-first.
Read the full methodology: including what this does not do →Find your highest-leverage map.
See where your ad budget does the most work. Create an account in seconds, or talk to our team to get your organization set up.